Appearance
See what the team published in Report
Report shows what each person published in a period: every revision, with its images, its videos and the time logged on it. It answers questions such as "what did the team do yesterday?" and "how far did Maya get with SH030 this week?".
It shows revisions already published. For the hours over months, see Stats. For the plan, see the Timeline.
Open Report
Click the clipboard button at the right of the header, next to Pipeline. Report opens on the studio you have open.
- The button only shows when your role has Report set to View. The studio owner always has it. See Roles and permissions.
- Without it, the page says You don't have access to the report. Ask an owner or an admin of the studio.
- You see only the revisions you can open. A project or a stage you can't open leaves its revisions out.
- Report counts images and videos. Other files of a revision stay in the chat of its stage.
Choose the period
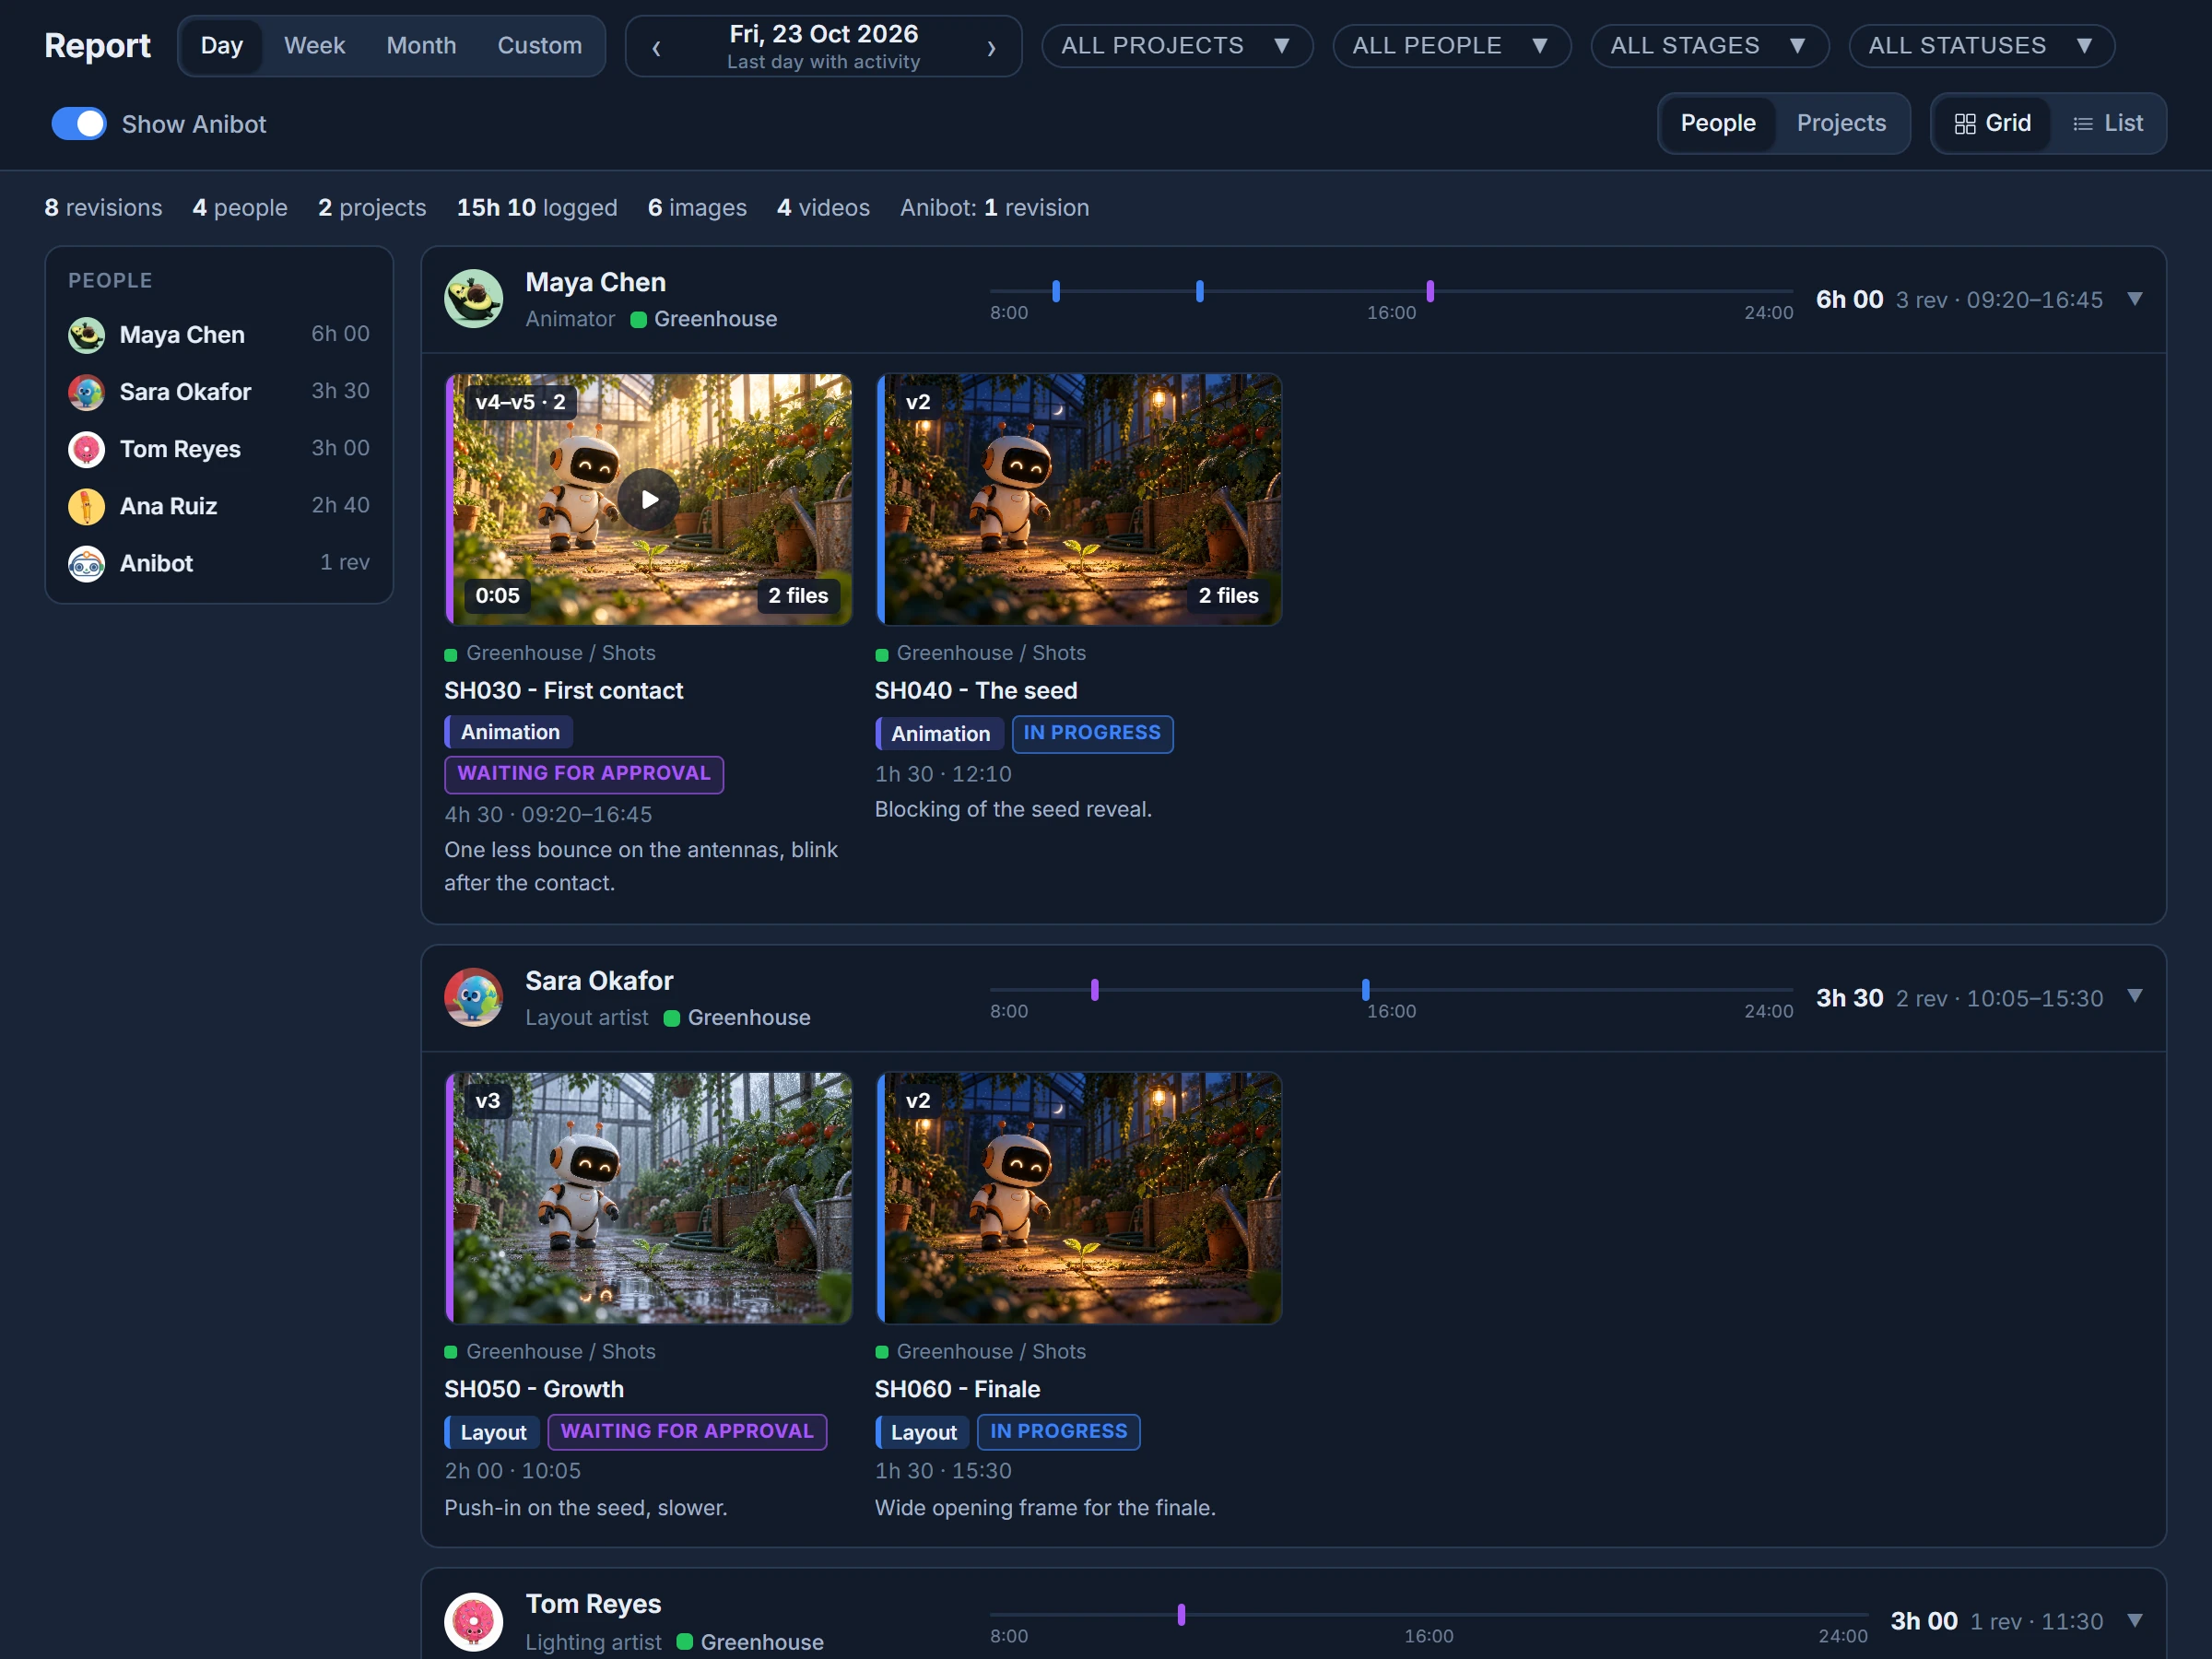
The bar at the top sets the period: Day, Week, Month or Custom.
- Report opens on the last day with activity before today, so on a Monday it shows the Friday. The date says Last day with activity under it. If nobody published anything before today, it opens on today.
- Week goes from Monday to Sunday, and Month from the 1st to the last day.
- ‹ and › next to the date go to the previous or next day, week or month. Days skip Saturday and Sunday.
- Custom shows From and To instead of the arrows. Both days count.
- Switching between Day, Week and Month keeps the day you were looking at.
When nobody published a revision in the period, the page says No revisions in this period. Use the arrows to go to another one.
Filter
Next to the date, four menus narrow the report: All projects, All people, All stages and All statuses.
- Each menu lists what the period has, with how many revisions each one has, such as Greenhouse (8). Tick one or more. The menu then shows the name you picked, or how many, such as 2 people.
- All statuses ends with No status, for revisions published without one.
- Show Anibot shows or hides the revisions of Anibot and other bots. Picking someone in All people hides them too.
- Clear filters shows again everything the period has.
When nothing matches, the page says Nothing matches these filters.
Group by and the view
Group by, at the right of the bar, sorts the report into groups:
- People: one group per person, with their projects inside.
- Projects: one group per project, with its people inside.
The group with the most time logged comes first. Anibot and other bots have their own group at the end, folded. Click the header of a group to fold or unfold it.
The header of a group shows:
- The person, with their role and projects, or the project, with how many people worked on it.
- A ruler from 8:00 to 24:00 with a mark for each revision, at the time it was published and in the color of its status. Hover a mark to see its time, item and version. In a week the ruler has one stretch per day. A month or a longer period has no ruler.
- The time logged, how many revisions and the time of the first and the last one, such as 6h 00, 3 rev · 09:20–16:45.
On the left, the People or Projects column lists every group with its time. Click one to jump to it.
Grid and List at the far right change how each group shows its revisions. Your browser remembers the one you pick.
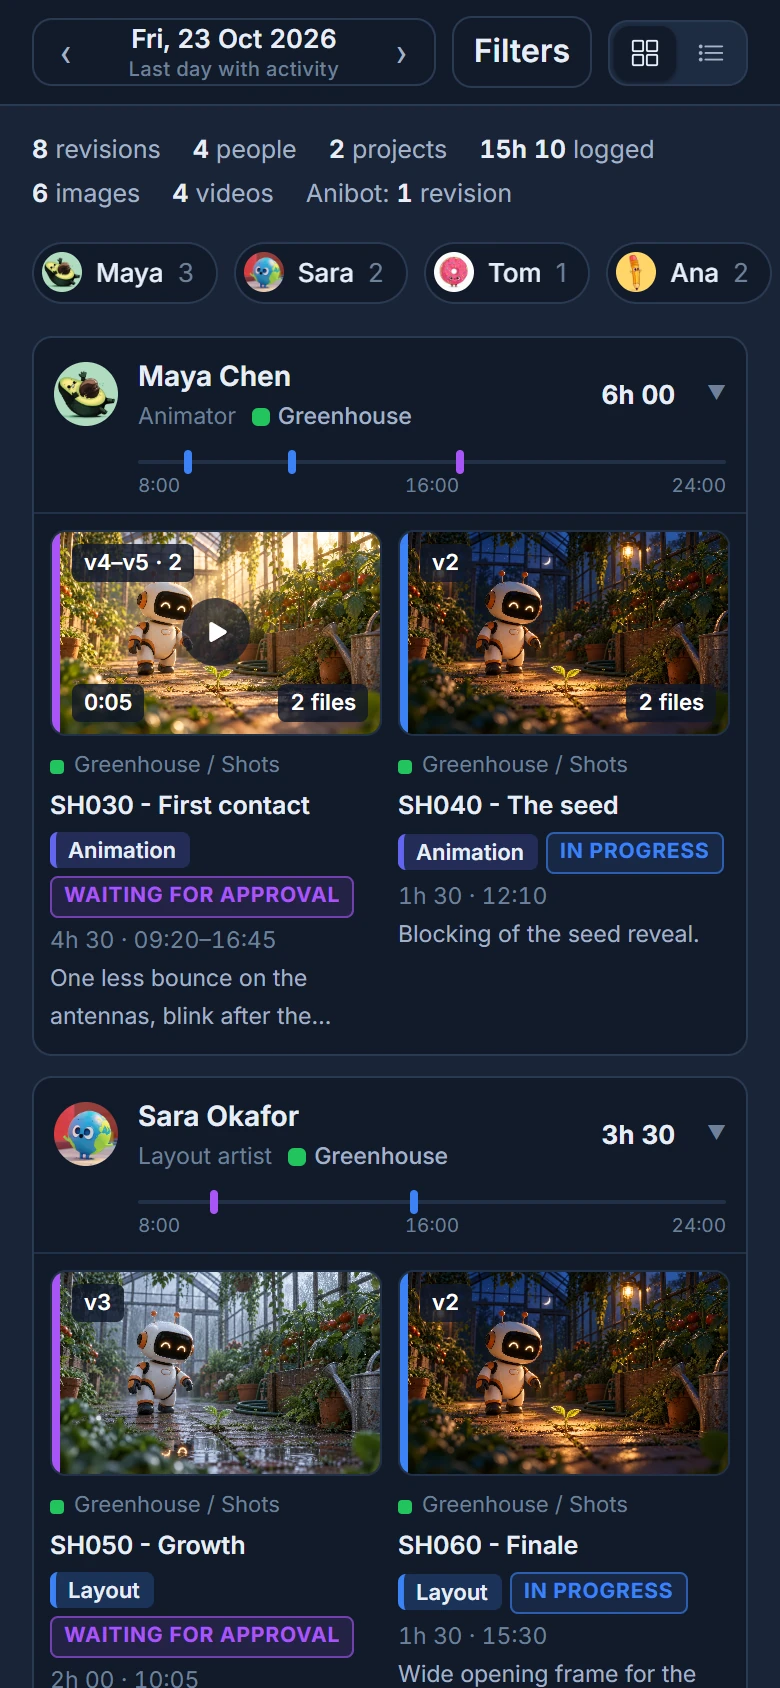
- Grid shows one card per item and stage. When a person published several versions of the same stage in the period, they stack in one card, such as v4–v5 · 2. The card shows the first picture of the newest version, the length of a video and how many files there are. Under it: the project and space, the item, the stage, the status, the time logged and the newest text the artist wrote.
- List shows one row per revision: the time, up to four pictures, the item, the stage, the version, the status, the time logged and the text. Versions of the same stage sit next to each other, in the same order as the Grid.

The summary line
Under the bar, one line adds up the period as the filters leave it: how many revisions people published, how many people and projects, the time logged, and how many images and videos. Bots come apart at the end, such as Anibot: 1 revision, and their revisions don't add to the time.
Open a revision in Review mode
Click a card or a row. Review mode opens full screen on that file: a card opens the first file of its newest version, a row the first file of its revision.
Review mode works as it does in Production: you can draw and send feedback, compare and share. Above the player, a bar shows who published the file and when, such as Maya Chen · 16:45, and where it sits, such as 3 / 12 in this report.
- ‹ and › in that bar, or the ← and → keys, go to the previous or next image or video of the report, in the order the page shows them. To step frames, use , and ..
- Open in Production in that bar opens the chat of the stage on that revision.
Each card and row also has an Open in Production button, which shows when you point at it. It opens the chat of the stage on that revision without going through Review mode.
On a phone
On a phone, or in a narrow window, the bar shrinks to the date with its arrows, Filters and the Grid and List buttons. Filters shows how many filters are on.
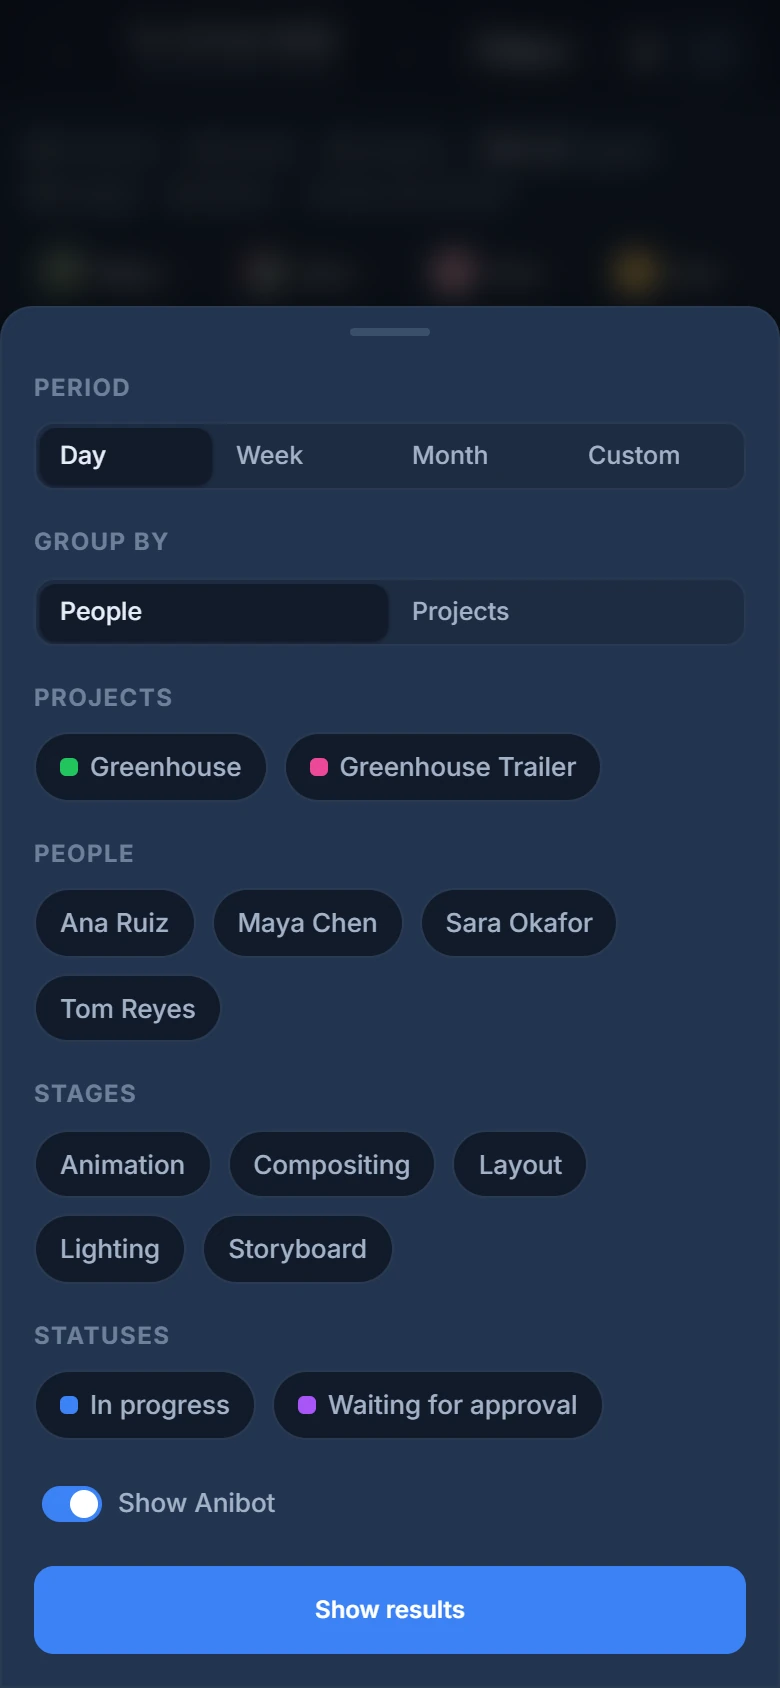
Filters opens a sheet from the bottom with the period, Group by, every filter as buttons you tap on and off, and Show Anibot. Show results closes it.
The People or Projects column becomes a row of names above the report, with how many revisions each one has. Swipe it sideways and tap a name to jump to it.