
Appearance
See where the hours went in Stats
Stats adds up the time the team has logged, for the whole studio. It answers questions such as "how many hours has Greenhouse taken so far?", "which shot took longest?" and "what has Maya worked on this quarter?".
It shows time already logged. For the plan, see the Timeline. For each person's days, see Log time and review it.
Open Stats
Stats has no tab in the header. Open it at its address: add /stats to the address of Animanager, for example animanager.com/stats, and bookmark it.
- It needs the Timeline module on and Timeline module set to Use in your role, the same as the Timeline. Without them, the address takes you to the studio's home. See Turn modules on and off and Roles and permissions.
- You see the projects and spaces you can open, and no others.
- It shows the studio you have open. To see another studio, switch studio in the studio list: Stats stays open.
Choose the dates
From and To, at the top right, set the days Stats counts. They apply to the three tabs at once, and every change reloads the numbers.
Stats opens from 1 January 2020 to today: everything the studio has logged. Narrow it to a month or a quarter to see that period. The dates are not kept: a reload goes back to the start.
What counts as time
Stats adds up:
- Revisions. The time spent typed when someone publishes a revision, counted on the day it was published. See Publish a revision.
- Time entries. Hours added on a stage without a revision, such as those added from the Timesheet or by the studio owner on the Timeline. They count on the day they were saved, not the day of the work, so a Monday entry for last Friday counts on Monday here.
- Recurring work. Hours logged on recurring work, under the name of its stage.
It leaves out the plan and the estimates, and time logged on a whole project, space or item with no stage.
Projects
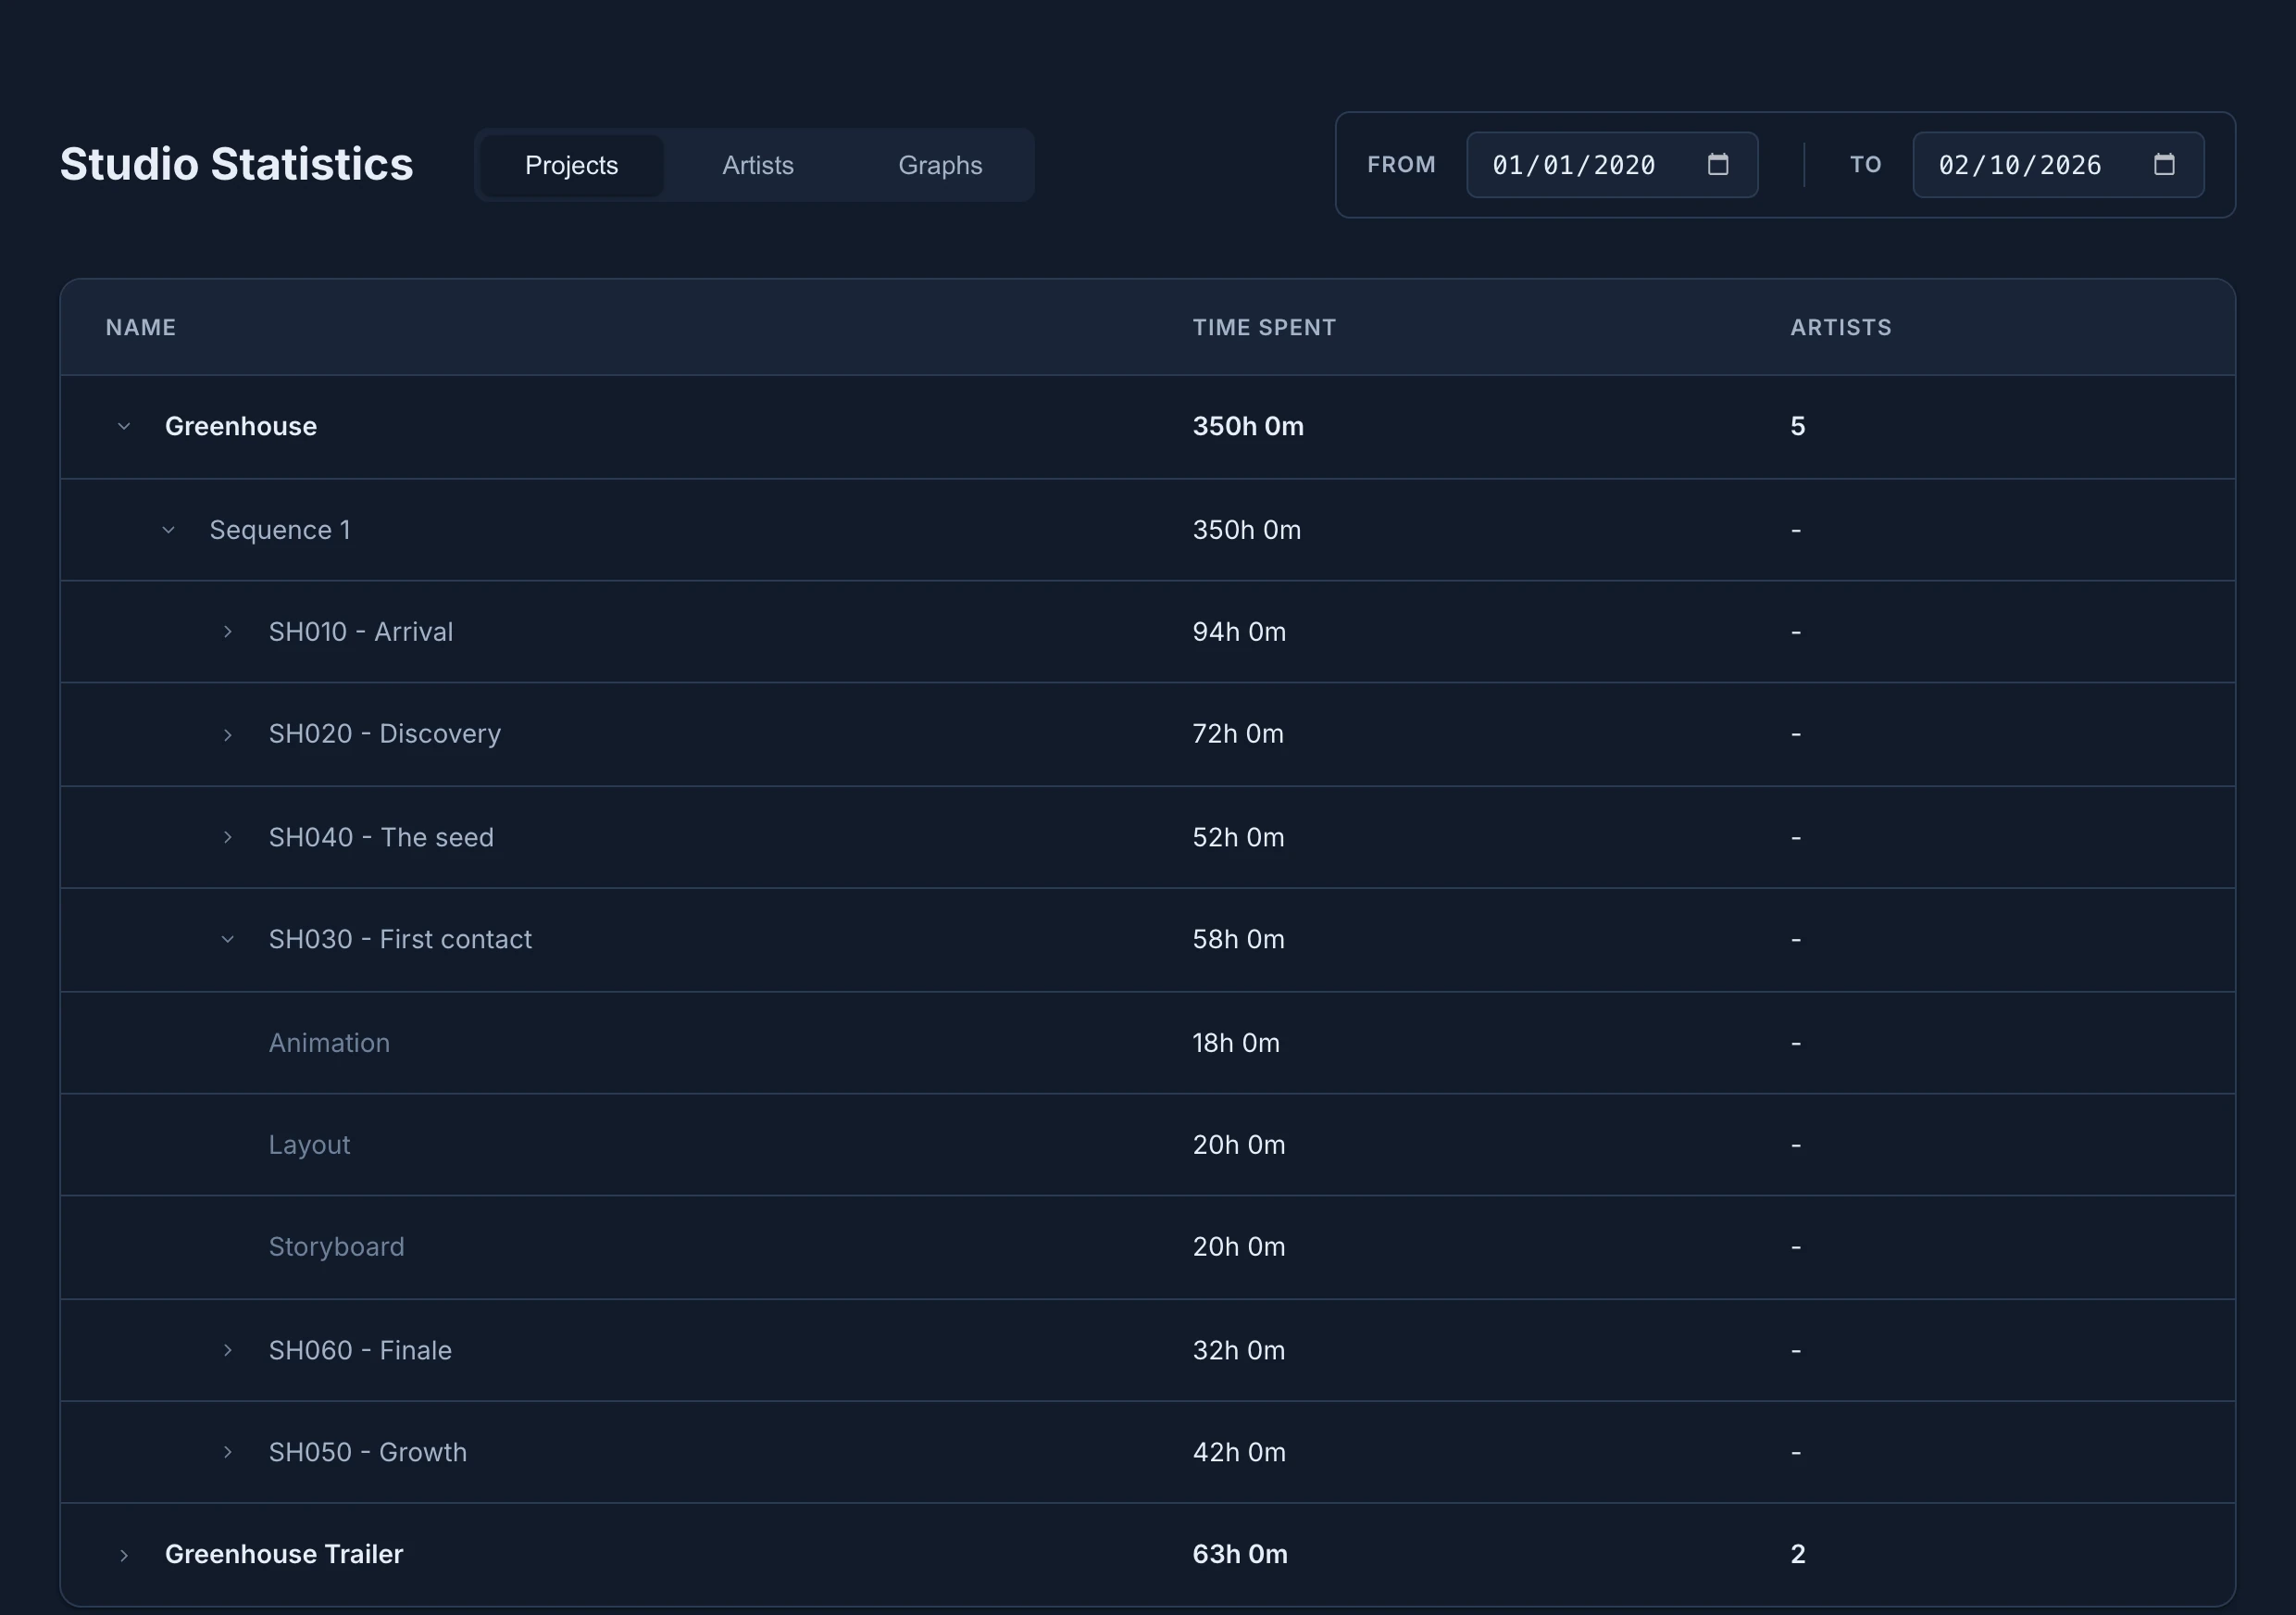
Projects lists each project with its Time Spent and how many Artists logged time on it, the project with most hours first.
- Click a project to open its collections.
- Click a collection to open its items.
- Click an item to see the time of each of its stages.
Good to know:
- The levels are project, collection, item and stage. Spaces don't appear.
- Items that are not in a collection appear under a collection called Default.
- Stages, items and collections with no time in the dates are left out.
- Times read in hours and minutes, such as
125h 30m, never in days. - Artists is counted for the project only. The rows under it show -.
Artists
Artists lists each person with their Time Spent and Tasks Contributed: how many stages they logged time on. The person with most hours comes first.
Click a person to see each stage they worked on, as Project > Item > Stage, with their time on it and how many entries it took.
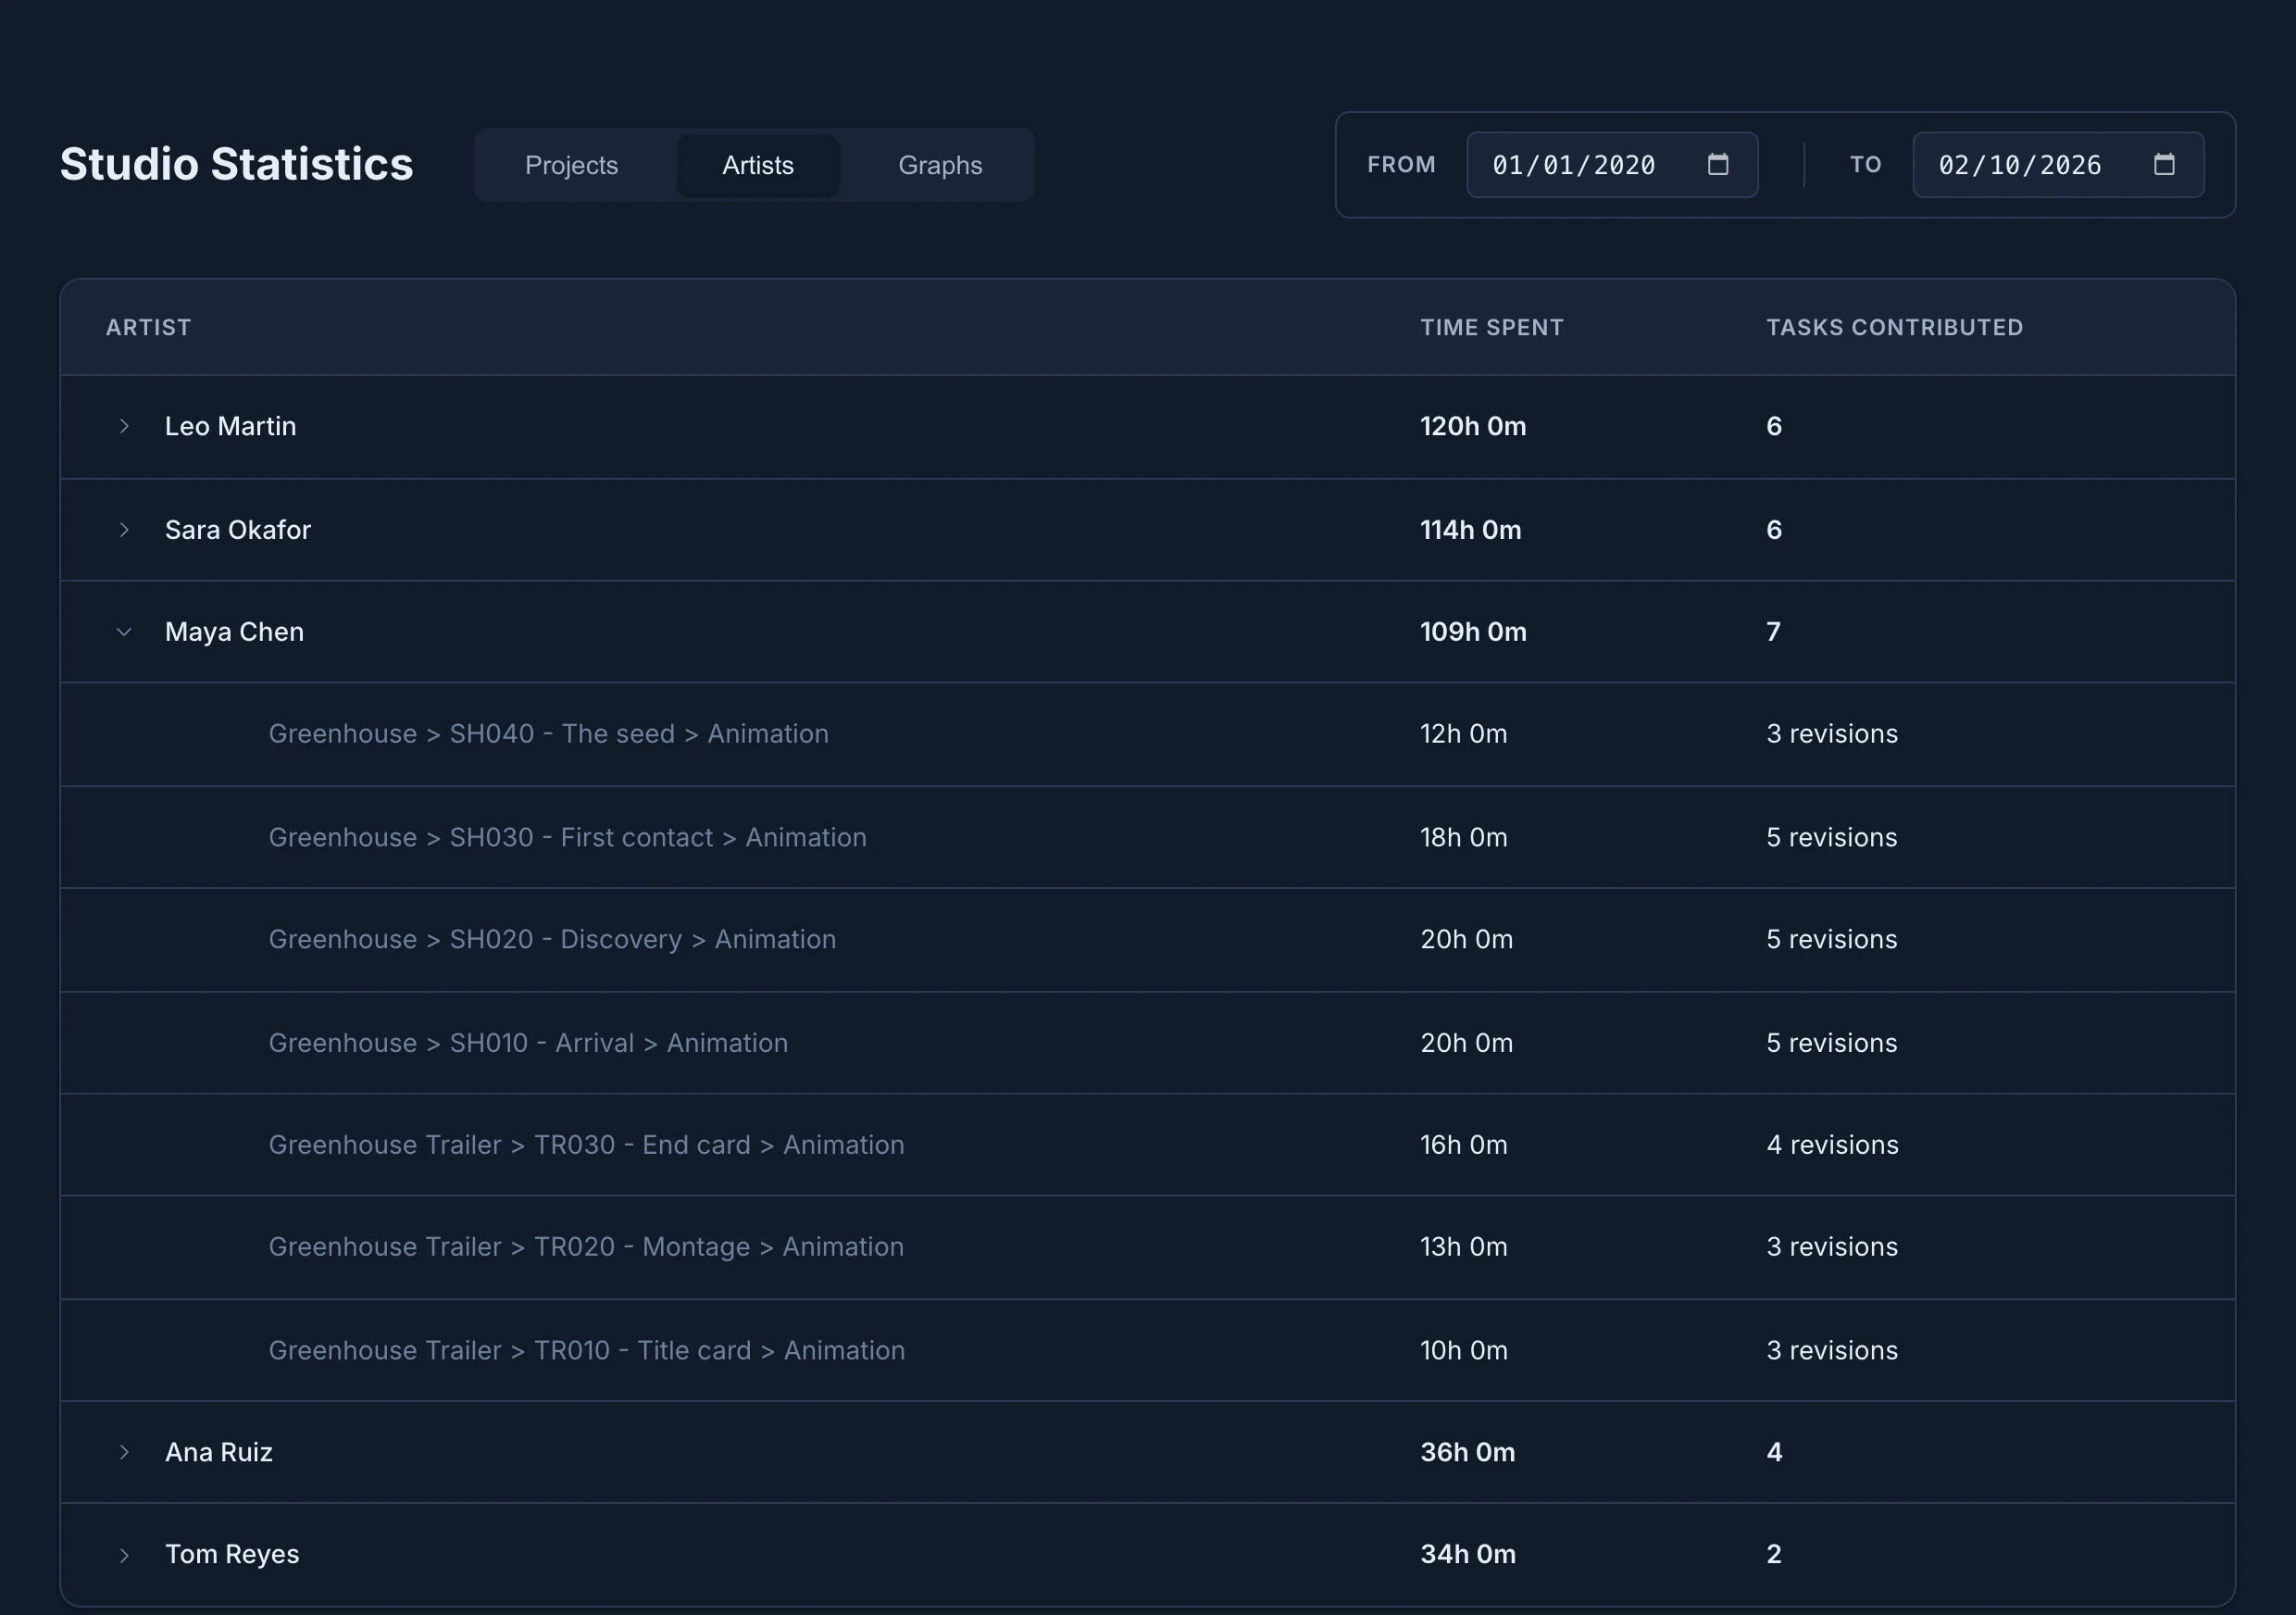
The number of revisions on each line counts every entry of time: revisions and added hours.
Graphs
Graphs draws Hours by Project: one line per project, one point per period.
- View shows the whole studio, Studio (All Artists), or one person.
- Granularity groups the hours by Months, Weeks or Days. Months is the default. Weeks are shown as
2026-W40. - Point to a period to read each project's hours and its share of that period, such as
Greenhouse: 54.5h (57.7%). - Click a project under the chart to hide its line, and again to show it.
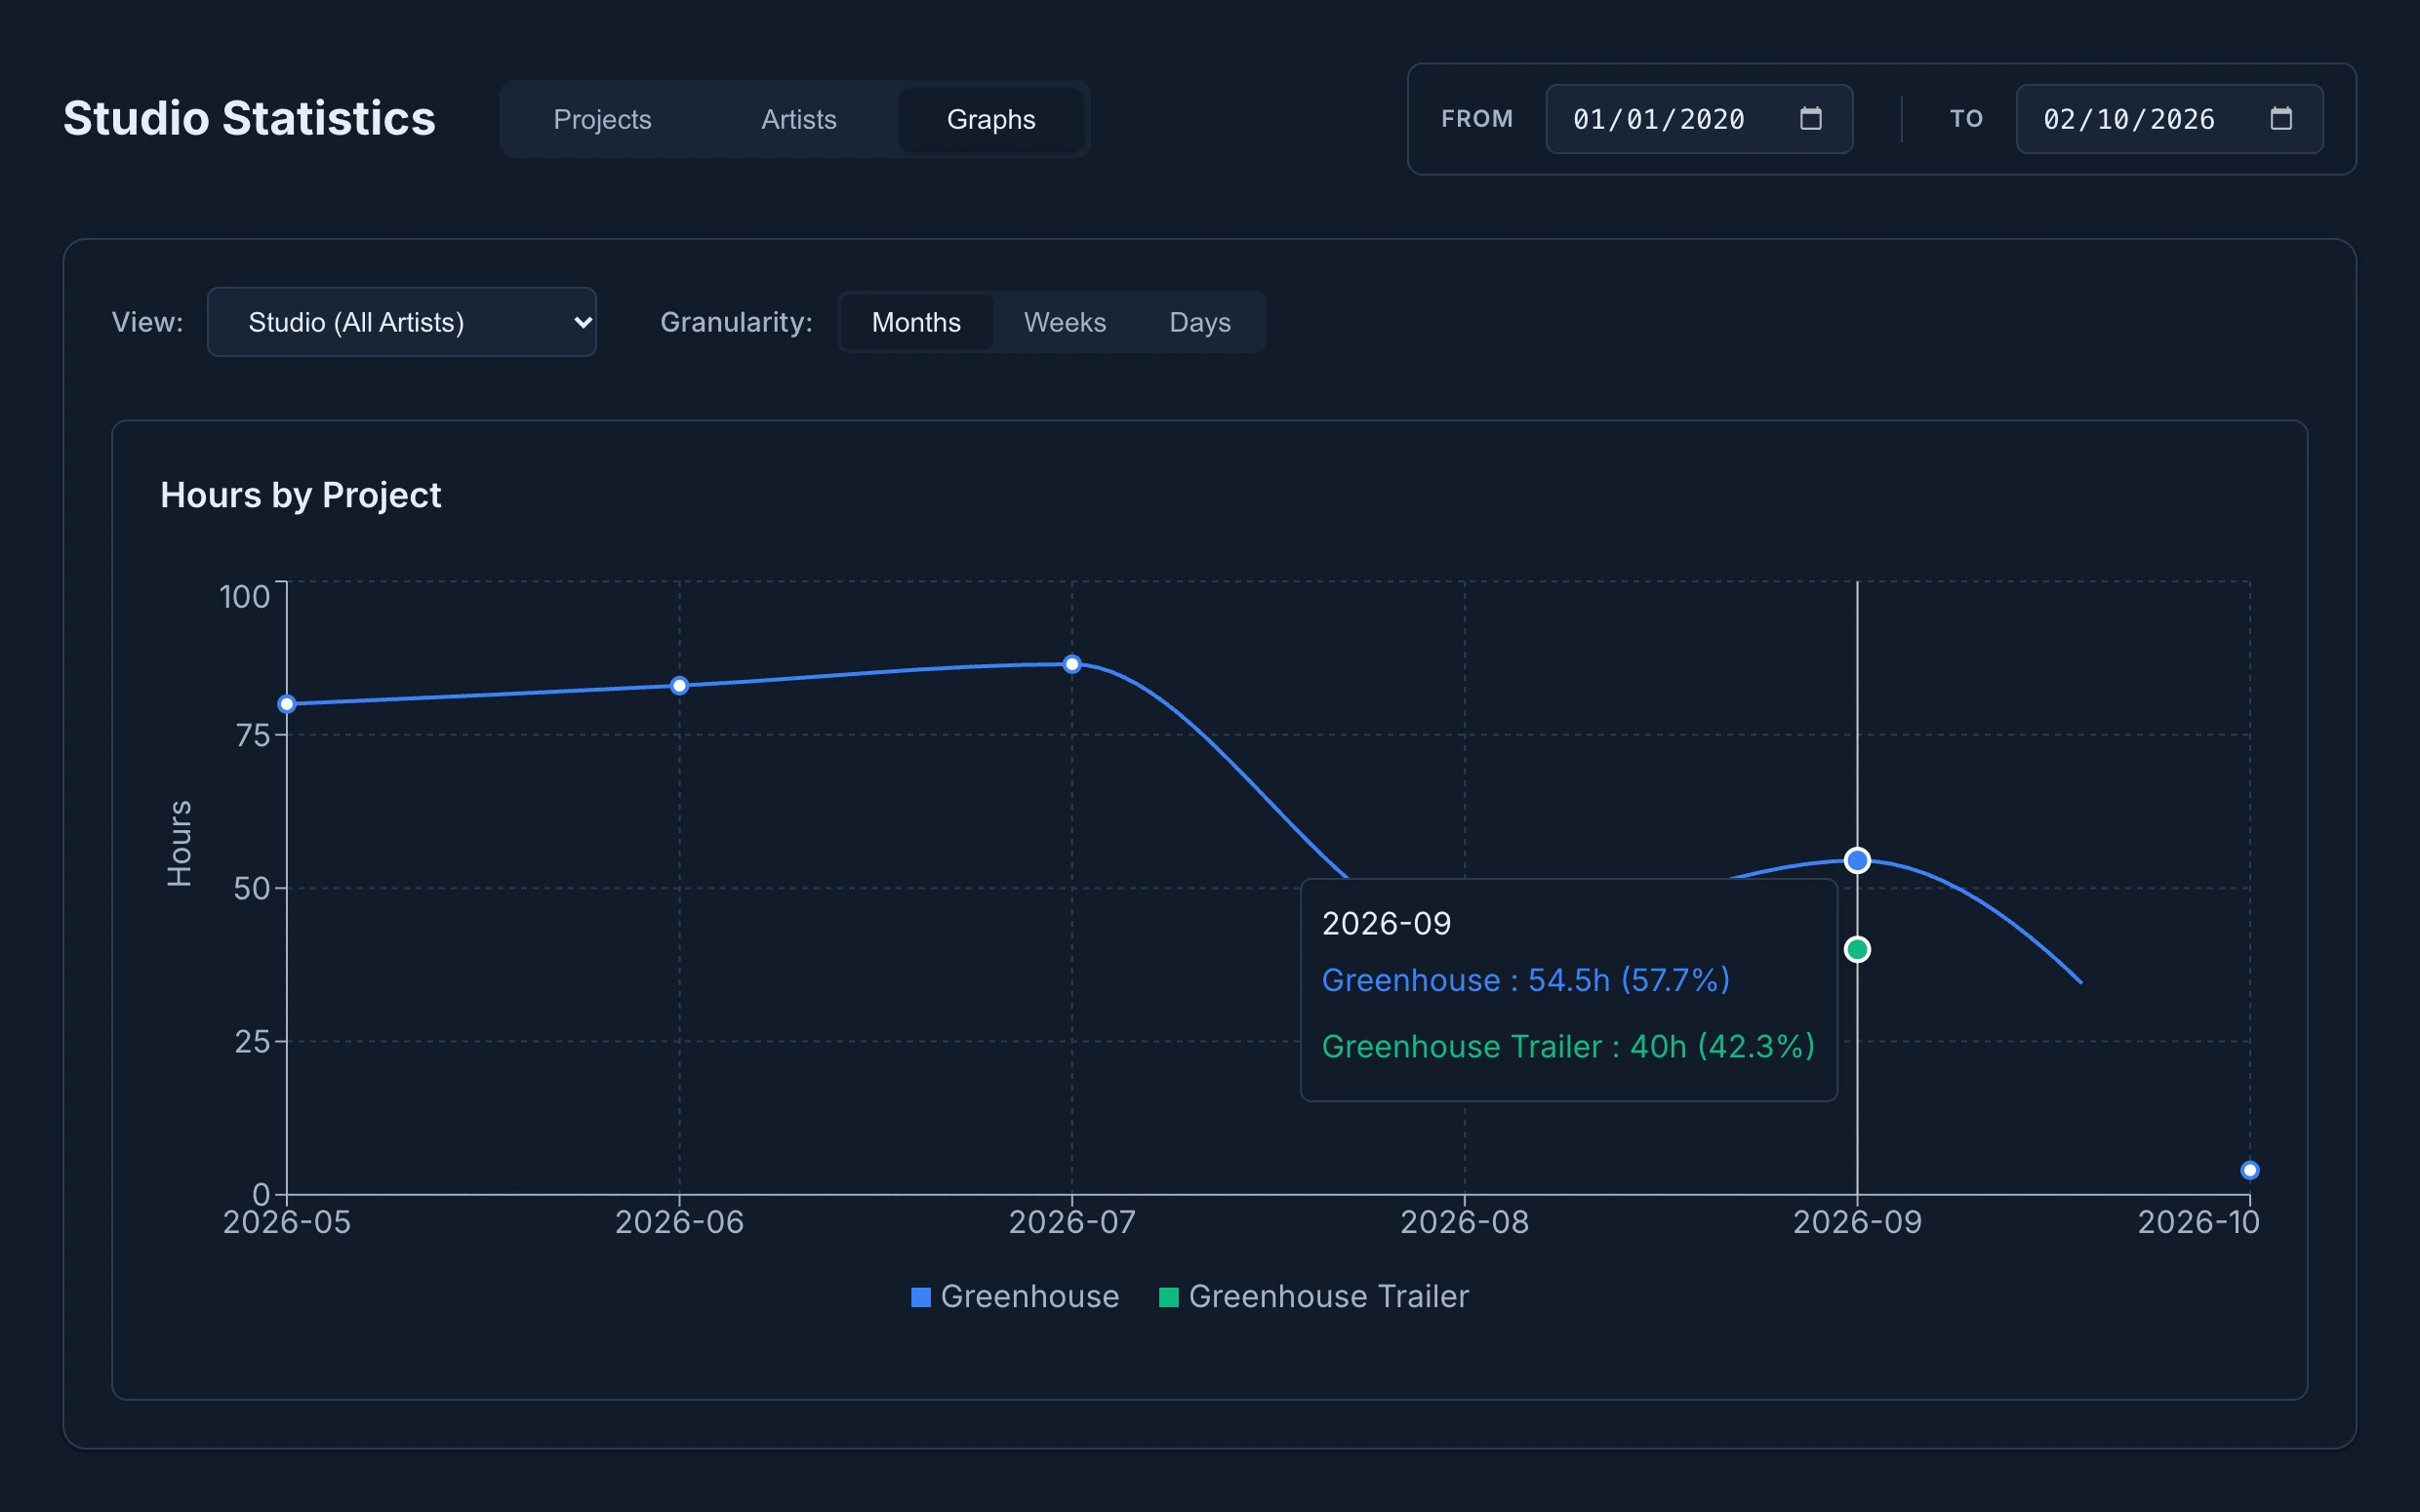
Periods with no hours are left out of the chart, and a project's line breaks where it has none. A project's color can change when you change the dates.
Other places called Stats
- Stats in the right-click menu of a bar on the Timeline, and the Stats tab of an item's dialog, show the pace and estimates of one item, not this page.
- Export Stats (.csv), in the menu of a project or a space in the Tree, downloads its hours as a spreadsheet. Stats itself has no export.