
Appearance
Attach data tables and chart them
A CSV attached to a revision shows as a table in the thread: sortable, searchable, with totals, colors and the change against the previous revision. When a stage has tables, its Data view charts them over time. It works on any stage, for a render report, a progress count or the results of a campaign.
Attach a table to a revision
- Save the table as a CSV: UTF-8, comma separated, one header row, then one row per line.
- In the chat of the stage, choose Post as: Revision.
- Attach the CSV with Attach files, or drop it on the composer. To describe its columns, attach a schema file with the same name ending in
.table.jsontoo, such asrender-report.csvandrender-report.table.json. - Publish the revision. See Publish a revision.
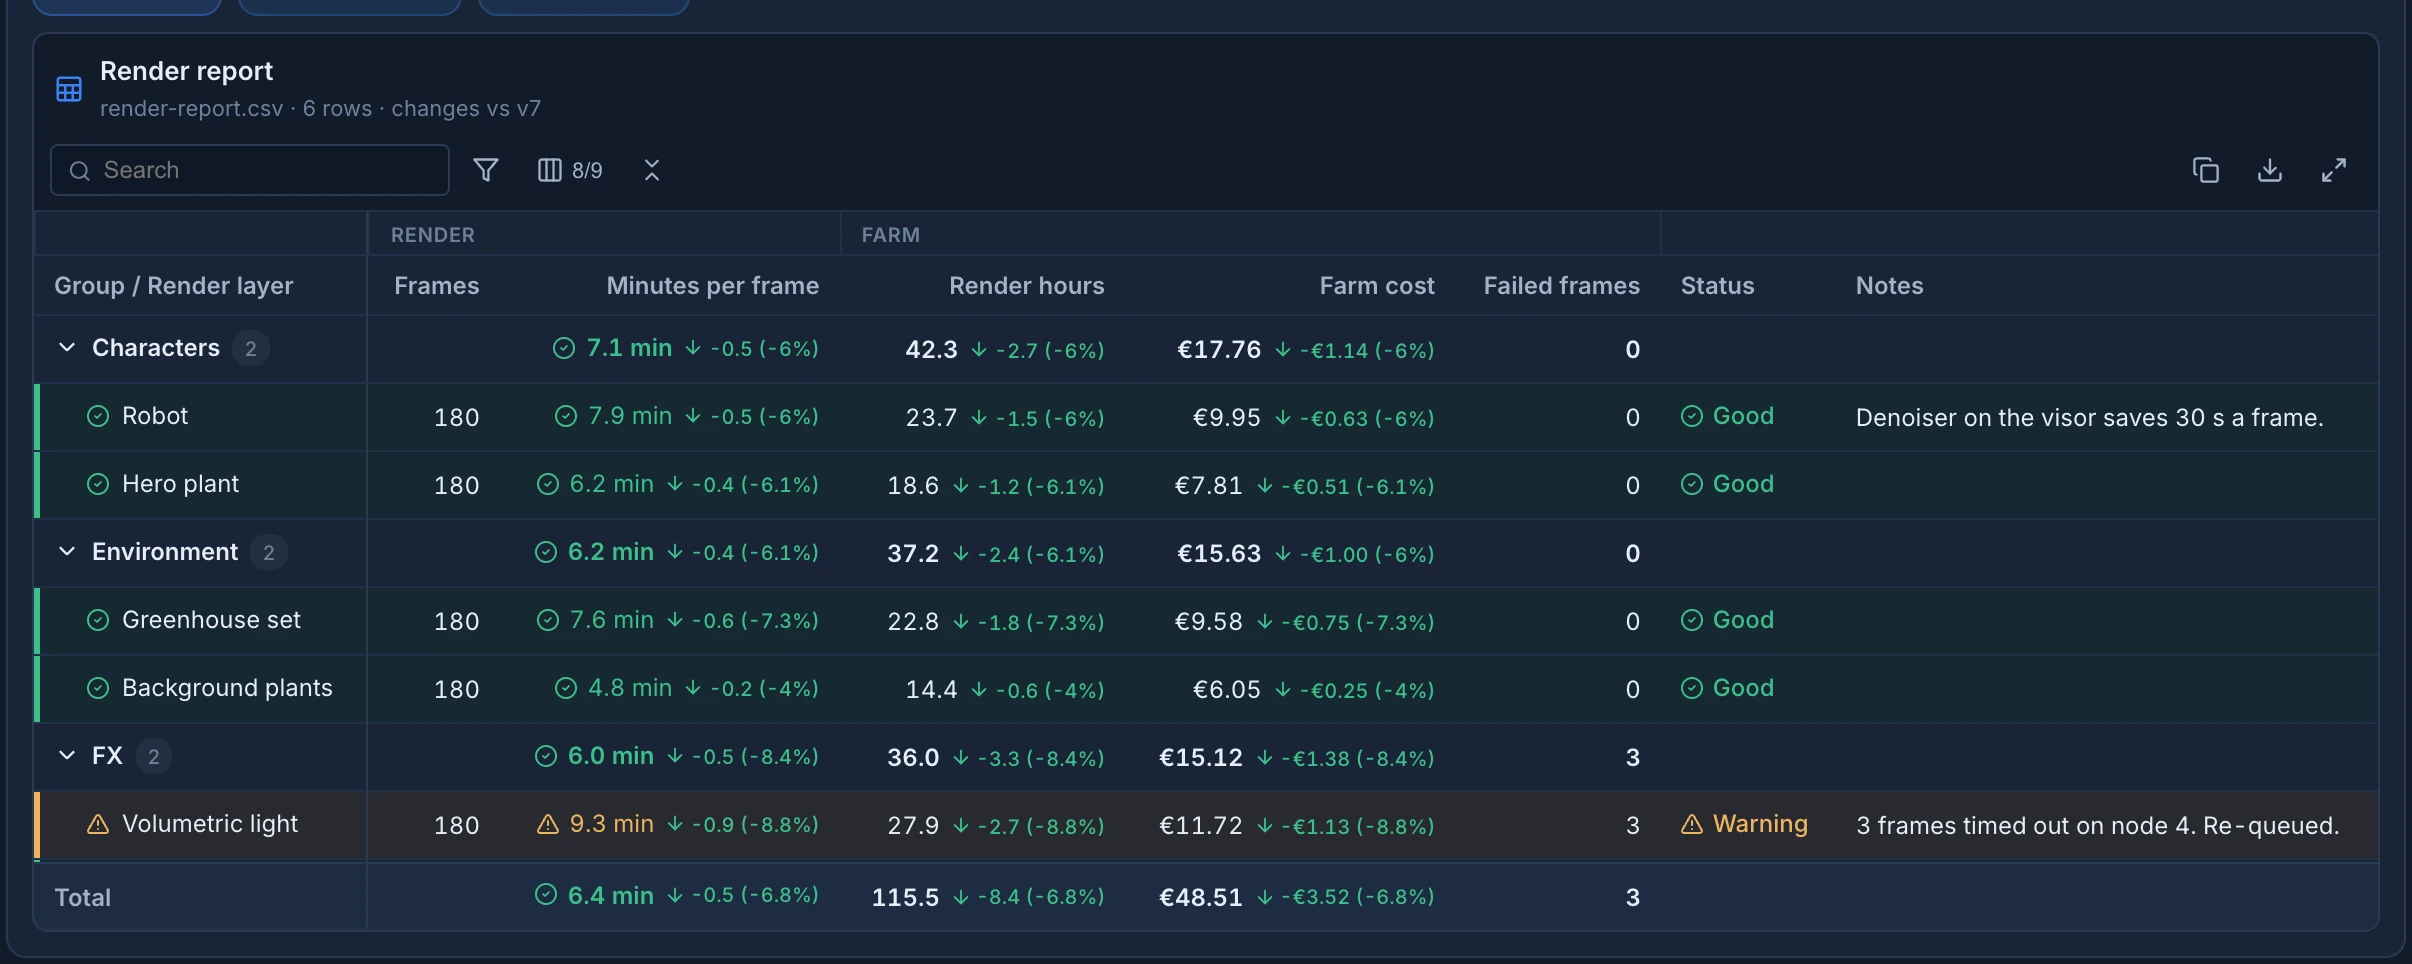
The revision shows the table in place of the file, with its title, its file name, its number of rows and the revision it compares with. A revision can carry several tables. Only revisions turn a CSV into a table: a CSV attached to a feedback stays a file.
When the table could be read but something is worth knowing, such as a column the schema doesn't describe, a notes badge next to the title lists it.
Write numbers with a dot for decimals and no thousands separators, such as 1234.5. A field in double quotes can hold commas and line breaks. Each header must be unique and not empty. A CSV can have up to 5 MB, 5,000 rows and 80 columns, and 10,000 characters in a cell. A schema file can have up to 512 KB.
When the files can't be read as a table, the revision is still published. It shows the files and Not shown as a table. Fix the files and publish again:, with each problem, such as a row and column whose value does not fit its type. Fix them and publish a new revision.
Read the table
- Click a column header to sort by it. Click again to reverse the order, and a third time to go back.
- Search keeps the rows where any shown column contains the text.
- Filter by column adds a filter under each header. Text columns match what you type. Number columns also take
>10,<=5,=3or a range such as5..20. The table then says how many rows match. - The columns button, such as 8/9, shows or hides columns.
- Collapse all and Expand all fold grouped rows. Click a group to fold only that one.
- Copy the table (paste into a spreadsheet) copies the shown columns and the rows left by the search and filters, with their raw values, in the order of the file.
- Download the CSV downloads the file as it was attached.
- Open large opens the table in a large window.
Hover a header to read its description, and a change to see the previous value and whether it is better or worse. A picture or video in a cell opens large when you click it, and a link opens in a new tab.
In Review mode, when you look at the CSV of a revision, the table fills the viewer.
Describe the table with a schema file
Without a schema file, Animanager works out each column's type from its values. A schema file adds a title, labels, money and percent formats, totals, grouped rows, colors, and the columns to compare between revisions. It is a JSON file you write next to the CSV.
This is render-report.csv, one row per render layer of a shot (four of its six rows):
csv
group,layer,frames,samples,min_per_frame,render_hours,cost,failed,status,notes
Characters,Robot,180,512,7.9,23.7,9.95,0,good,Denoiser on the visor saves 30 s a frame.
Characters,Hero plant,180,384,6.2,18.6,7.81,0,good,
Environment,Greenhouse set,180,256,7.6,22.8,9.58,0,good,
FX,Volumetric light,180,1024,9.3,27.9,11.72,3,warn,"3 frames timed out on node 4. Re-queued."
And this is its render-report.table.json, the schema of the table in the picture above:
json
{
  "version": 1,
  "title": "Render report",
  "tableKey": "render-report",
  "rowKey": "layer",
  "rowStatusColumn": "status",
  "hierarchy": ["group"],
  "columns": [
    { "key": "group", "label": "Group" },
    { "key": "layer", "label": "Render layer" },
    { "key": "frames", "label": "Frames", "type": "integer", "aggregate": "none", "group": "Render" },
    { "key": "samples", "label": "Samples", "type": "integer", "aggregate": "none", "group": "Render", "hiddenByDefault": true },
    { "key": "min_per_frame", "label": "Minutes per frame", "type": "number", "decimals": 1, "unit": "min",
      "aggregate": "weighted_avg", "weightBy": "frames", "better": "lower", "thresholds": { "good": 8, "warn": 12 },
      "group": "Render", "description": "Average farm time of one frame." },
    { "key": "render_hours", "label": "Render hours", "type": "number", "decimals": 1, "aggregate": "sum", "better": "lower", "group": "Farm" },
    { "key": "cost", "label": "Farm cost", "type": "currency", "currency": "EUR", "decimals": 2, "aggregate": "sum", "better": "lower", "group": "Farm" },
    { "key": "failed", "label": "Failed frames", "type": "integer", "aggregate": "sum", "better": "lower", "group": "Farm" },
    { "key": "status", "label": "Status", "type": "status" },
    { "key": "notes", "label": "Notes", "type": "long_text" }
  ]
}
The whole table
| Field | What it does |
|---|---|
version | Always 1. |
title | The title shown above the table. |
tableKey | Links the tables of the same kind across revisions: changes and charts compare tables with the same key on the stage. Letters, digits, dots, dashes and underscores. Without it, the CSV's name without .csv. Keep it the same from one revision to the next. |
rowKey | The column that names each row, to find the same row in other revisions. Every value must be filled and appear once. Without it, the first column when it names each row once. With no row key, the table shows no changes. |
rowStatusColumn | A status column that colors each row and puts its icon in the first cell. |
hierarchy | Up to 4 columns, outermost first, that group the rows into sections you can fold, each with subtotals. |
timeColumn | A date column that places the table on the time axis of the Data view. See Chart a stage in the Data view. |
columns | One entry per column you want to describe, by its key: the CSV header. Columns left out keep the type Animanager works out. |
Each column
| Field | What it does |
|---|---|
key | The header of the column in the CSV. Use a short name that does not change, and put the text to show in label. |
label | The header shown in the table. |
type | One of the types below. |
currency | For currency: a 3-letter code such as EUR or USD. |
decimals | How many decimals to show, from 0 to 10. |
unit | Text shown after the value, such as min or px. |
aggregate | How the total and the subtotals are made: sum, avg, weighted_avg, min, max or none. Only number columns have one. Without it, integer and currency columns add up and the rest have none. |
weightBy | For weighted_avg: the number column that weighs each row. Cost per result weighted by results gives total spend over total results. |
better | higher or lower: which way is good news. It colors the changes green or red. |
thresholds | { "good": 8, "warn": 12 }. With better: "lower", a value at or under good is good, at or under warn is a warning, and above is bad. With higher, the other way round. Needs better. |
colorScale | true, or { "min": 0, "max": 100 }: shades each cell from the worst value to the best. Not together with thresholds. |
description | Text shown when you hover the header. |
group | Columns next to each other with the same group share a header above theirs. |
hiddenByDefault | true hides the column until the viewer shows it. |
Types
| Type | Write | Shows |
|---|---|---|
text | Anything | The text |
long_text | Long or multi-line text, in quotes | Wrapped text |
number | 1234.5, -3 | A number in the viewer's format |
integer | 42 | A whole number |
currency | 182.40. A $, €, £ or ¥ before or after is accepted | An amount in the column's currency |
percent | Percentage points: 2.35 or 2.35% are both 2.35 % | A percentage |
date | 2026-09-30 or 2026-09-30T14:00:00Z | A date |
status | good, warn, bad or neutral (also ok and green, warning, amber and yellow, red and error, none and grey) | Good, Warning, Bad or Neutral with an icon |
media | An Animanager media id, or a link to a revision or a media file in Animanager | A thumbnail that opens large |
link | An http:// or https:// address | A link that opens in a new tab |
An empty cell stays empty in every type. Without a schema, a column whose values are all statuses becomes status, all whole numbers integer, all numbers number, all ending in % percent, all dates date, all web addresses link, and text over 200 characters or on several lines long_text. Money and media are never worked out: declare currency and media in the schema.
Compare with the previous revision
Each table compares with the table of the same tableKey in the stage's previous revision that has one. The header says which, such as changes vs v7, or no earlier table to compare.
Every number that changed shows an arrow and the difference, with the percentage (in a percent column, the difference in points). With better in the schema, the change is green when it is good news and red when it is not. The totals and subtotals compare too. Rows are matched by their row key, so a table needs one to show changes.
Chart a stage in the Data view
Once a stage has a table that could be read, its thread has a Data button next to Media. It charts the tables of one kind, the newest 60, one point per revision. Anyone who can open the stage can open its Data view.
The button shows when the thread has a revision with a CSV, or when one of the stage's five newest tables could be read. Tables published a moment ago may still be being read: the note under the chart says files still being read, and Reload picks them up.
- In the chat of the stage, press Data.
- When the stage has several kinds of table, choose one in Table.
- Choose the column to chart in Metric, or click a headline figure.
- Choose a view: Lines, Stacked, Per row or Table.
- Click a date in a chart or in the table to open that revision.
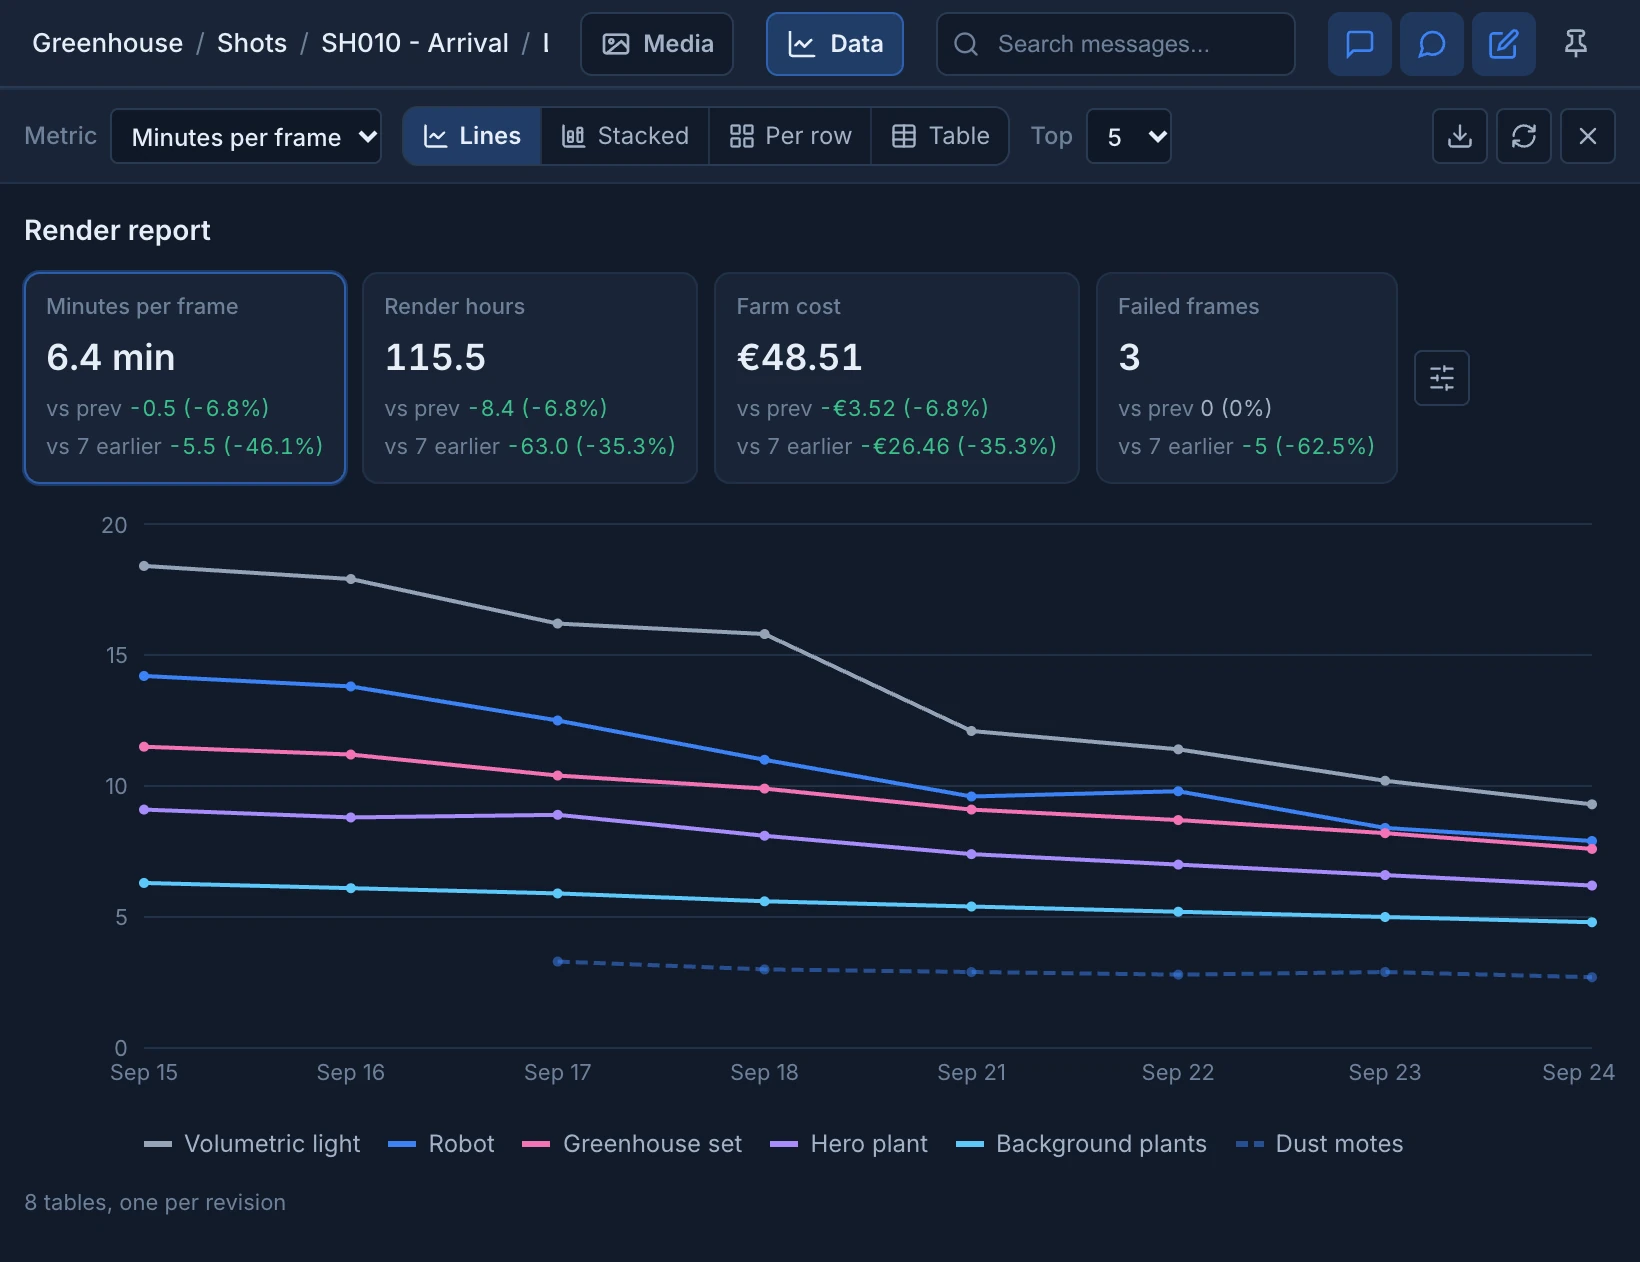
- Headline figures show the table total of a column at the latest point, and its change vs prev and vs 7 earlier, green or red by
better. The button next to them chooses which columns they show, among those with a total. - Lines draws one line per row. Top keeps the 3, 5, 8 or 10 rows with the highest latest value, and groups the rest as Others, totalled like the column.
- Stacked piles the rows up as bars. It works only for columns whose total is a sum, such as cost or frames. With another column, it says why and offers the columns that add up.
- Per row draws one small chart per row, with Show all when there are many.
- Table lists the values, newest date first, with the total.
- The download button saves the chosen column as a CSV, every row included. Reload reads the tables again, and Back to the thread closes the view.
Hover a chart to see every row at that date. A row missing from a table, such as a layer not rendered that day, is a gap, never a zero. A row keeps its color in every view. The view remembers your choices for each kind of table, in this browser.
By default, each revision is one point, at the date it was published. With timeColumn in the schema, each table sits at the latest date of that column, one point per date: a revision published later for the same date replaces the earlier one, as for a corrected daily report.
Let an agent publish and read tables
An AI agent connected through MCP can attach a CSV and its schema file when it publishes a revision you asked for. If a file can't be read, its reply lists the problems, so it can fix them and publish again.
Agents also read the tables of a stage back as data, to compare with earlier revisions before deciding what to do. They can read one column over time, such as minutes per frame per layer over the last 14 reports, with each row's latest change and whether it is getting better or worse. See production_stage_tables and Connect Claude, Codex or another MCP client.